
Impact at a Glance: Key Frameworks You Need in Your CSR Dashboard
Published by
Christine Tringale
on
Some tips to help you think through what to show on your impact dashboard
Introduction
In 2024, social impact leaders need to think carefully about what data to show and how to represent it in the most effective way.
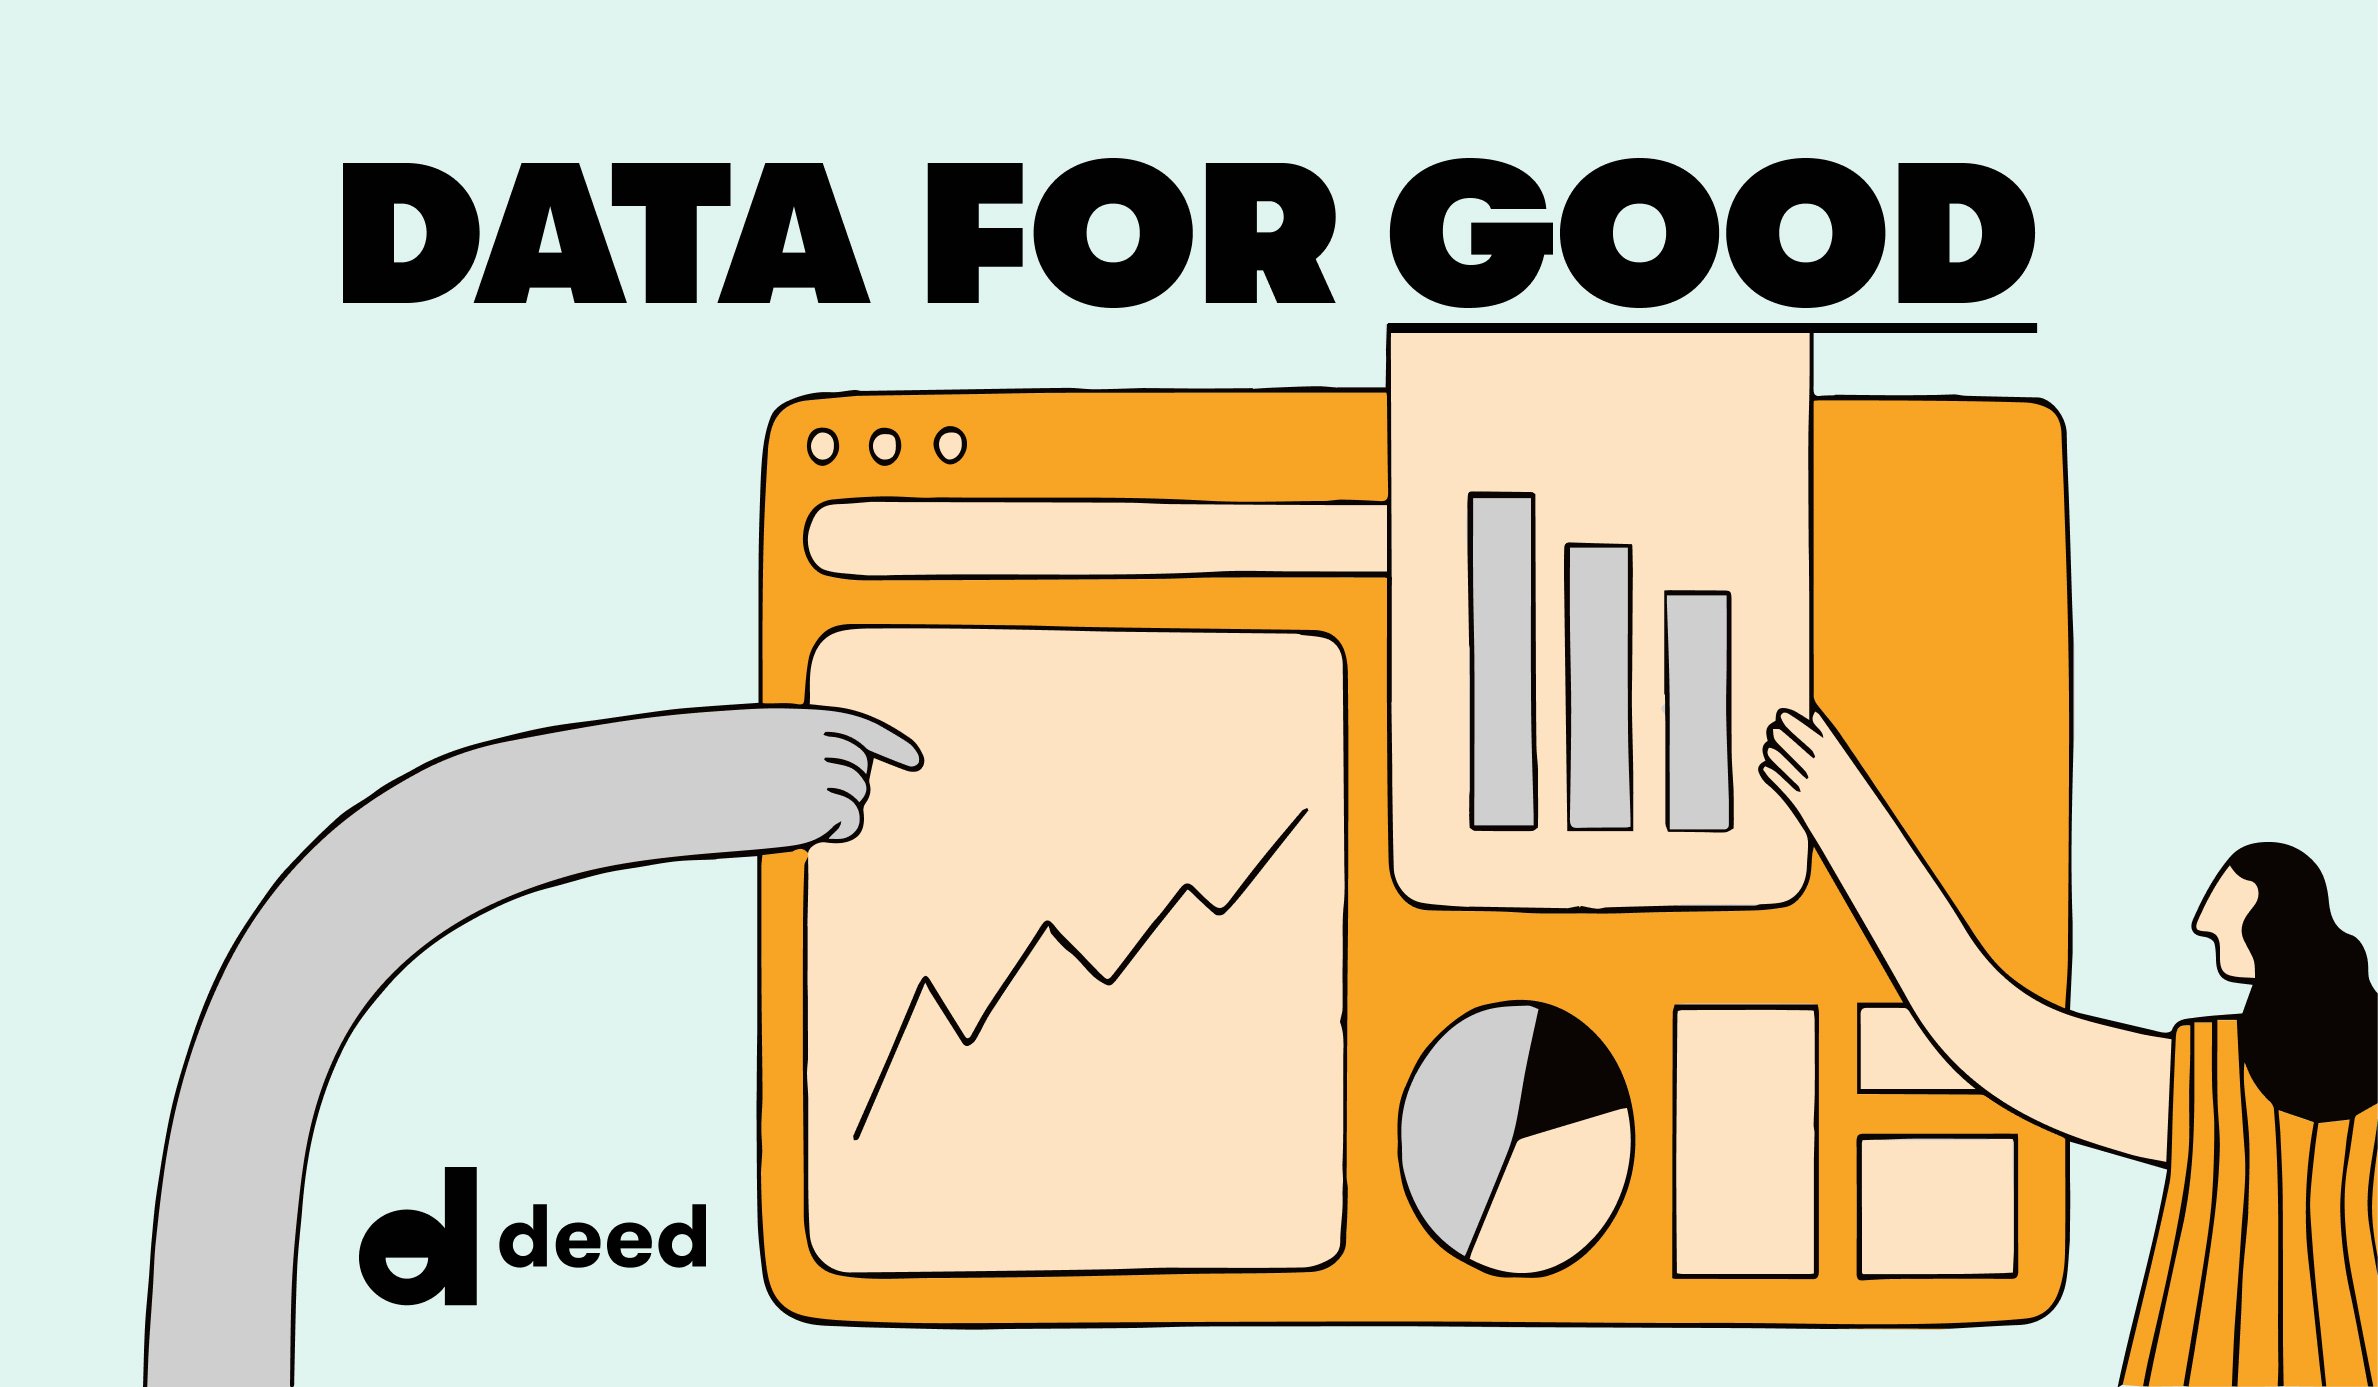
Data dashboards can be great tools to have in your impact reporting toolbox. When configured correctly, they can show key data metrics and trends in a visual way that makes it easy for all team members (whether they’re data-savvy or not!) to quickly see important trends and insights. Different types of data visualizations can also be helpful depending on your organization’s unique needs.
Here are some metrics to keep in mind as you take a data-driven approach to corporate social responsibility (CSR).
THREE SOCIAL IMPACT REPORTING FRAMEWORKS YOU NEED ON YOUR DASHBOARD IN 2024 AND BEYOND
1. Tracking
Tracking is everything, but depending on the goals of your impact program, you might have different focus areas.
Some examples that I have seen with Deed’s clients include total donation amount, total volunteer hours, percentage of employees who donate or volunteer, and number of nonprofits impacted. These goals can be tracked throughout the year, with all efforts totaling up to the annual goal, or you can break them out into interim goals.
I commonly see impact leaders break annual goals out by quarter. Quarterly goals make a lot of sense for efforts that may not be consistent throughout the year. For example, with #GivingTuesday in November, the end of the year often sees much higher donation amounts.
If your impact program has an annual fundraiser in the spring, then you would expect a boost there as well!
2. Learning
There is always more to learn about your impact program, whether the program has been around for years and you are looking for new ways to engage the current workforce, if you're running new programs, or even if you're just getting off the ground.
Because of their visual nature, dashboards are a great way to draw insights from your data. For example, you may want to launch a new volunteer campaign, but you do not know at which point in the year your employees volunteer the most. You could add a line chart to your dashboard that has a line for each year, with the x-axis showing the total volunteer hours by month.
A quick look at this line chart would show you if there are regular periods of higher volunteering across the years, and when to hold your volunteer campaign.
3. Evolving
What is the point of learning, if not to apply your knowledge and try something new?
For example, you may have created a clustered bar chart that shows the amount of donations by cause area for the past three years, and from this bar chart, you may have learned that donations to animals are decreasing, while donations to education are increasing. With this knowledge, you launch a fundraiser for education-focused nonprofits. If your dashboard has a line chart showing employee donations over time, you may see that donations spike with this new fundraiser.
Using dashboard visualizations to draw insights, taking an action, and then revisiting the dashboard to see the impact of those actions is a great way to continue to grow your impact program!
Final question: How do I know if my social impact platform is collecting the data I would need on a dashboard?
In the social impact space, we have to make a wide variety of complex decisions with serious real-world implications—and we have to do it quickly. Dashboards can be a valuable resource for tracking goals, learning, and evolving your impact program. By working backward from what you want to track, in which areas you are looking to learn, and how you can evolve your programing, you can populate your dashboard with key data visualizations that will provide great insights for you and your team.
So how do you make sure your social impact platform has a strong grasp on your essential metrics—so that your dashboards are always up to date?
Deed is an enterprise social impact platform that makes it fun and easy for millions of employees to share their time, money, and talent with causes they care about. We started as a viral volunteering app, and today our platform gives the world’s most inspiring brands—from lululemon to Airbnb—one exceptionally-designed home for all of their purpose-driven activities.
Corporate grantmaking, employee donations/matching, diversity & inclusion, and employee resource groups (ERGs) are only the beginning. Because over the past three to five years, everyone’s expectations for Fortune 500 corporate social responsibility have radically changed. But with our trusted integration partners like Workday and PayPal, hand-in-hand customer service, and a collaborative product team, Deed’s platform moves at the speed of work.
Ready to bring all your organization’s good deeds into a single, exceptionally designed platform? Request a demo today.